Hi,
regional plots, such as those done using locuszoom (http://locuszoom.org/) can be very useful to explore GWAS signals. I think all the necessary tools are already available in Hail (such as filter_intervals and ld_matrix).
One would feed a list of variants, and a distance from aforementioned variants, and a function would create a structure that could be plotted. It would have to contain all variants within distance D of the variant of interest (filter_intervals should do nicely), as well as the ld between each variant in that interval and the variant of interest (so in this case, something lighter than ld_matrix as we basically need only one row/column from that matrix). I think the recombination rate and the genes can be loaded in the global annotation (Or should this be in the variants annotation?), and therefore made available for inclusion in the output structure.
Do you think that would be possible?
Cheers,
Steph
Ideally this would be expressed as a “windowed” operation with a filter so that we don’t slide the window across the entire genome. In this case, the filter would limit us to the windows centered at the loci of interest. We are very interested in adding windowed operations to a future version of Hail.
A less efficient approach, but one that is possible in Hail 0.1, is, as you’ve stated, to use filter_intervals to reduce to an interval of interest and then calculate the ld_matrix.
Something like:
intervals = [(Interval(Locus(v.contig, v.start - size), Locus(v.contig, v.start + size)), v) for v in variants]
for (interval, v) in intervals:
    ldm = vds.filter_intervals(interval).ld_matrix()
    variants_in_region = ldm.variants_list()
    my_variant_index = next(i for i in xrange(len(variants_in_region)) if variants_in_region[i] == v)
    my_ld_numpy_array = ldm.to_local_matrix().toArray()[my_variant_index]
You can then do something with my_ld_numpy_array, such as write it to a file or print it to the terminal.
What would you like to do once you have the ld array for each variant of interest?
If it’s more efficient, windowed operations would be ideal, of course. But I guess that requires a lot of work, so until these operations are implemented in a future version of Hail, it may be simpler to do something based on current capabilities?
The ld_matrix is an overkill by the way, it would be, in this particular case, more efficient to have a function calculating ld between a single variant and all the others (from the selected interval). There may be cases where you need to calculate it for multiple variants in the same interval (I’ll get to this later, below), but still, always a small number in comparison to the total number of variants.
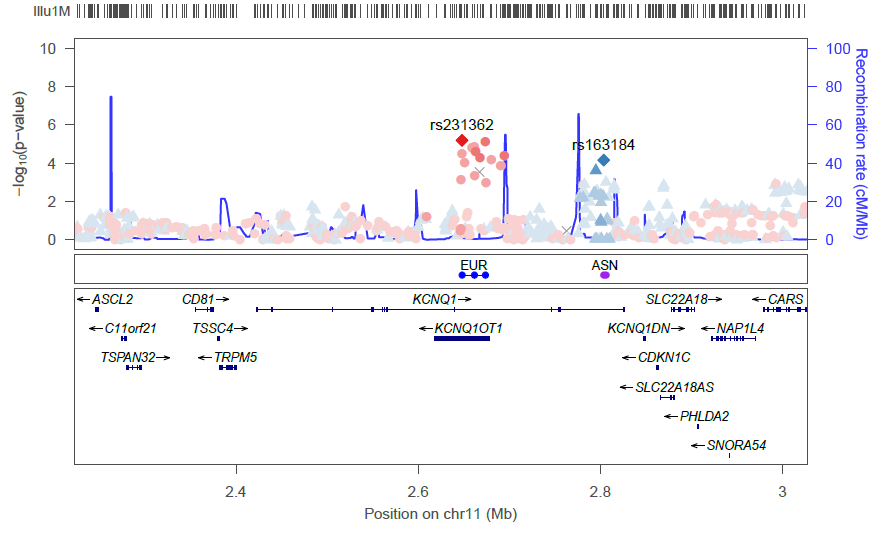
The goal is to produce a plot such as this one: preview
It shows the LD between a selected variants and all others around, put in the perspective of their p-value; it also shows the region’s recombination rate, as well as the genes. Recombination rate for build 37 can be found there: ftp://ftp.hapmap.org/hapmap/recombination/2011-01_phaseII_B37/. Note: when plotting meta-analyses p-values, the median of the LD from each cohort should be used.
As mentioned earlier, in some regions, it may be interesting to get a plot using two, or more, references, like this. LD is calculated between each selected variant and all others; each selected variant is attributed a colour (here blue and red); all variants in higher LD with the “blue” variant will be displayed in a shade of blue, while those in stronger linkage to the other variant are displayed in a shade of red.
So, if we annotate the vds with genes (I still need to check how to do that, and where to get the info in a format easily recognised by Hail) and recombination rate, the output of the function could be some kind of structure containing all the necessary information to produce such plot.
Hope this makes sense.
Calculating just the ld vectors would be great, but unfortunately there’s no straightforward way to do that in Hail 0.1.
In the future, I imagine you could:
- annotate the intervals of each variant with the variant for that interval
- drop any variants that didn’t fall in at least one interval
- “join” this vds against itself on the targeted variants, this would yield, effectively, a VDS where each variant had a pair of genotype arrays: the genotypes for this variant and the genotypes for the variant that owns this interval (or perhaps multiple variants if they have overlapping intervals)
- compute the dot-product of these arrays
It’s that third step that Hail 0.1 doesn’t have an (efficient) answer for. We also lack array dot-product, but that’s simple to add.
Getting Gene Annotations
Annotating with genes is straightforward, but the workhorse method is rather a mouthful of documentation due to its generality. The basic idea is this:
gene_intervals = KeyTable.import_interval_list('genes.interval_list')
gene_annotated_vds = vds.annotate_variants_table(gene_intervals, root='va.genes', product=True)
Getting Recombination Rate
I think you accidentally included an empty link. IIUC, recombination rate is an Interval → Double relationship. Getting this data in hail again relies on the annotate_variants_table method:
rr_intervals = KeyTable.import_interval_list('recombination_rate.interval_list')
rr_annotated_vds = vds.annotate_variants_table(rr_intervals, root='va.rr', product=False)
In this case, you should ensure that none of the intervals overlap (i.e. your recombination_rate.interval_list represents a function from genetic position to recombination rate).
Sorry about the empty link, it points to a ftp folder, now explicitly written.
I see, more complex than I thought it would be, I think I’m gonna try to work something out using the ld matrix in the interval, and if it’s too costly, export the intervals to plink.
What fields need to be in genes.interval_list? Does how I name fields make a difference, or only their (fields) order?
The recombination rate is given as:
Chromosome      Position(bp)    Rate(cM/Mb)     Map(cM)
1               55550           2.981822        0.000000
1               82571           2.082414        0.080572
1               88169           2.081358        0.092229
1               254996          3.354927        0.439456
There are three valid interval list formats and it shouldn’t have a header line. The one you’re looking for is tab separated with five columns: chromosome, start, end, direction, and value/target.
Is the recombination rate defined at a specific position, or for an entire interval? Is the first line of that table conveying the information: “On chromosome 1, from position 0 to position 55550, the recombination rate is 2.981822 and the Map is 0.000000”? To use that table as an interval list, you’ll want to reformat it like this (except with tab separators instead of spaces):
1  0      55550  + 2.981822,0.00000
1  55551  82571  + 2.082414,0.080572
1  82572  88169  + 2.081358,0.092229
1  88170  254996 + 3.354927,0.439456
Then in python:
from hail import *

hc = HailContext()
vds = hc.read('your data')
rr_interals = KeyTable.import_interval_list('recombination_rate.interval_list')
rr_annotated_vds = vds.annotate_variants_table(rr_intervals, root='va.tmp', product=False)
  .annotate_variants_expr('va.rr.rate = va.tmp.split(",")[0].toDouble',
                          'va.rr.map = va.tmp.split(",")[1].toDouble')
I see. Thank you, it’s very helpful.